Overseas signals and the A-share open: timing, controls and ETF costs
Decision: retain this as exploratory forecasting research. Much of the opening-gap information overlaps with SPX. Adding HSI, N225 and KS11 after domestic, FX and SPX controls does not show a stable incremental benefit. Neither historical source availability nor actual ETF fills are certified.
Evidence stage: retrospective, annually refitted daily-bar diagnostics, reviewed 2026-10-18; source histories end 2026-10-16. The prior experiment inspected some of these years, so the following folds are not a fresh untouched holdout. Methods and reviewed aggregates are public; supplier histories and daily prediction rows remain external.
What changed from the first exploration
The first pass compared index opening gaps and open-to-close returns. Its same-day index long/cash calculation was hypothetical. Domestic equity ETFs normally use T+1, so that calculation cannot establish an executable ETF result. This extension uses two different questions:
- Can completed overseas daily bars improve an A-share index forecast at 08:45 Shanghai?
- Does that information help a long/cash ETF exposure entered at an opening auction and retained until at least the next tradable open?
The second outcome includes another overnight interval. It does not isolate the first day’s open-to-close return. Ordinary cash equity ETFs cannot generally monetize an opening-gap forecast by buying before the already established opening price.
Availability and data audit
Decisions are fixed at 08:45 Asia/Shanghai. Source session dates are converted into UTC availability assumptions before an as-of join. US closes use America/New_York and its daylight-saving offset. HK uses 16:10 local; Tokyo uses its dated 15:00/15:30 close; Korea uses a conservative 15:30 close for all years. A one-hour publication allowance is added. Regular full-day closes conservatively bound earlier half-days; supplied bar dates do not independently prove calendar completeness. NYSE trading hours, HKEX hours, JPX November 2024 change.
TuShare FXCM daily dates are GMT dates. CNH, USD/JPY and EUR/USD mid-prices are eligible only after the GMT day ends plus one hour. Thus the previous GMT date’s complete FX bar is not eligible at 08:45 Shanghai the next morning: its assumed availability is 09:00. That lag is intentional. TuShare FX daily definition.
External signals measure the change between the latest eligible closes at consecutive A-share decisions. Moves during A-share holidays accumulate; foreign holidays do not repeat the same old daily return as new information. Selections older than ten calendar days are unavailable. A second scenario delays all external inputs, including FX, by one A-share observation.
| Audit | Finding |
|---|---|
| Source selections across targets and lag scenarios | 148,568 |
| Selected inputs later than the assumed decision cutoff | 0 |
| Historically verified retrieval vintages | 0 |
| Source selections older than ten days | 377; excluded from usable features |
| FX quote defect | One crossed USD/JPY bid/ask on 2019-07-07 excluded |
| ETF adjustment joins | No bar lacks an adjustment factor |
| 512480 extra adjustment date | 2021-03-26, a confirmed split suspension |
These checks establish temporal consistency under stated assumptions, not historical API timeliness. All raw pulls are current historical downloads. A provider could have published a bar later, revised it or omitted it at the original decision time. No historical retrieval timestamps have been fabricated. A strict historically available or newly forward-observed result remains unverified.
Controls and chronological fits
All models use training-only centering/scaling and ordinary least squares, with a zero forecast threshold for the ETF exposure rule. There is no tuning against test-year returns.
- Domestic + FX: previous own-index/ETF return, five-session momentum, 20-session volatility; previous CSI 300 return and five-session momentum; CNH, USD/JPY and EUR/USD changes.
- Global: domestic + FX plus SPX.
- All overseas: global plus HSI, N225 and KS11.
Expanding fits are made separately for each year from 2020 through 2026, with at least 252 usable earlier training observations. Every training label must end before the first decision of that test year. The last prior-year ETF target can end after that decision and is purged. Index evaluation has seven annual folds; 512480 begins evaluation in 2021 after adequate post-listing training data, giving six folds. 2026 is partial.
Forecast results
The table shows the reduction in mean squared error, 1 − MSE(augmented) / MSE(baseline), on common rows. Positive means lower prediction error; this differs from the first pass’s R² against a training mean. The intervals resample paired errors in ten-observation circular blocks, with 1,000 fixed-seed draws. They are descriptive and not adjusted for the family of comparisons.
| Outcome, scheduled availability | N | All overseas vs domestic + FX | Asian addition after SPX, 95% interval | Years with positive Asian increment |
|---|---|---|---|---|
| CSI 300 opening gap | 1,643 | +13.86% | +0.75% [−5.22%, +4.64%] | 2 / 7 |
| SW semiconductor opening gap | 1,643 | +11.92% | +1.16% [−1.67%, +3.34%] | 3 / 7 |
| CSI 300 open-to-close | 1,643 | +0.88% | −0.02% [−0.34%, +0.28%] | 2 / 7 |
| SW semiconductor open-to-close | 1,643 | +0.84% | +0.01% [−0.37%, +0.35%] | 3 / 7 |
| 510300 next tradable open | 1,642 | −1.36% | −1.40% [−2.66%, −0.22%] | 1 / 7 |
| 512480 next tradable open | 1,398 | +0.99% | −0.41% [−1.07%, +0.31%] | 2 / 6 |
Delaying external data by one A-share observation reduces the opening-gap Asian increments to −1.63% for CSI 300 and −1.42% for semiconductors, again with intervals crossing zero. The ETF Asian increments are −0.46% and −0.65%. The aggregate JSON includes all 36 comparisons and 246 annual rows, including negative findings. This is evidence of timing sensitivity, not proof of a particular provider’s arrival delay.
ETF proxy and cost results
510300 supplies broad-market exposure; 512480 supplies semiconductor exposure. The latter tracks a different benchmark from the SW semiconductor research index, so it is a proxy rather than an exact replication. Both were selected retrospectively from surviving products; there is no full historical ETF-universe selection test.
Open-to-next-tradable-open outcomes use raw_open × fund_adj. Known splits therefore do not become artificial 50% losses, and auction-limit guards use a split-adjusted reference. 512480’s 2021-03-26 missing market bar is a documented suspension, with resumption on March 29. One holding interval spans more than one A-share session; annualized Sharpe uses an approximate 252 observed intervals. SSE split and suspension announcement, ETF trading-rule FAQ, ETF daily units.
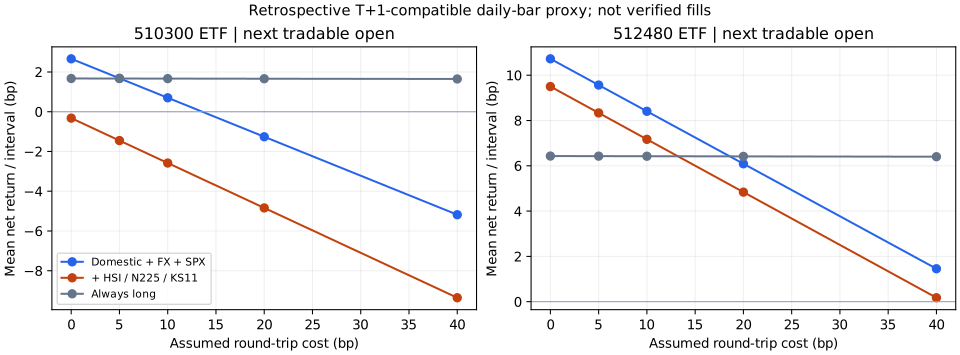
Positions are long or cash. Consecutive long forecasts retain the existing holding. Costs apply to entries, exits and terminal liquidation, not to imaginary daily round trips. Entry admission uses only prior 20-observation average turnover, converting TuShare’s thousand-yuan amounts to yuan, capped at 1% for a fixed reference notional. An auction open near the relevant 10% limit conservatively blocks the corresponding trade; blocked sales retain the holding. This approximates trading restrictions and does not establish an actual auction fill.
| Scheduled inputs, 10 bp round-trip assumption | Domestic + FX + SPX | Plus Asian indices | Always long |
|---|---|---|---|
| 510300 mean net return per observed interval | +0.70 bp | −2.58 bp | +1.67 bp |
| 510300 approximate annualized Sharpe | 0.13 | −0.45 | 0.21 |
| 512480 mean net return per observed interval | +8.41 bp | +7.17 bp | +6.42 bp |
| 512480 approximate annualized Sharpe | 0.63 | 0.54 | 0.41 |
The semiconductor global model is positive in this retrospective sample, but the Asian addition lowers its mean return. That does not establish a deployable global model: source vintages, ETF selection, estimated opening fills and cash-distribution assumptions remain unverified. The two ETFs cover different windows; their numbers should not be ranked as a same-period competition.
All 224 cost scenarios are available in the reviewed snapshot. They cover 0/5/10/20/40 bp round-trip assumptions, both input-delay cases, four exposure rules, and CNY 10,000/100,000/1,000,000 reference budgets with a 3 bp commission assumption subject to a CNY 5 minimum plus 1/5/10 bp one-way slippage. These are sensitivity inputs rather than actual broker quotes. The fixed reference budget is used for fees and prior-turnover admission while returns compound: it does not measure the capacity of a growing account. Lot rounding, order-book impact, distributions in a cash ledger, futures rolls and historical fee schedules are not replayed.
Reproduction and publication boundary
Run from the repository with its locked research environment:
PYTHONPATH=src python -m market_research.studies.overseas_leadlag.run \
  --index-inputs /external/index-histories \
  --extra-inputs /external/fx-and-etf-histories \
  --output /external/new-task-output
python scripts/export_overseas_leadlag_public.py \
  --input /external/new-task-output/reviewed_summary.json \
  --output /external/reviewed-public-summary.json
The index directory supplies the four {hsi,n225,ks11,spx}_tushare_daily.csv files plus 000300_sh_tushare_daily.csv and 801081_si_sw_daily.csv. The extra directory supplies {usdcnh,usdjpy,eurusd}_fxcm_fx_daily.csv plus {510300,512480}_sh_{fund_daily,fund_adj}.csv. Each CSV has trade_date; other fields follow the named TuShare endpoint. fund_daily.amount is in thousands of yuan. Output must be a new directory outside this repository. The run records input SHA-256 values, joins, annual training bounds, daily predictions, cost results and the assumed availability audit.
The public exporter permits only aggregate comparisons, annual statistics, cost scenarios, training bounds and audit metadata. Supplier bars, daily private predictions, provider credentials and local filesystem paths are excluded. The optional plotter scripts/plot_overseas_leadlag.py uses Matplotlib with the aggregate JSON; it does not load raw bars.
The next evidentiary step is a genuinely forward period with retained pre-cutoff retrieval receipts, followed by execution-proxy checks against auction or minute data. This release publishes the current retrospective result and its limitations; it does not qualify a production strategy.
海外盘面对 A 股的领先信息:时间、控制变量与 ETF 成本
当前结论:继续作为探索性研究,不进入生产策略。 开盘跳空的预测信息大部分与美股共同因素重叠。控制 A 股自身表现、汇率和 SPX 后,恒生、日经、韩国综合指数的增量不稳定。历史 API 到数时间与 ETF 实际成交均未得到认证。
证据阶段: 2026-10-18 审阅的日频历史滚动检验,数据截至 2026-10-16。此前探索已看过部分年份,这轮按年份向前滚动属于历史复核,不是新取得的独立样本外证据。公开内容包括方法和汇总结果;供应商行情与逐日预测保存在仓库外。
这轮改变了什么
第一轮分别预测指数的开盘跳空和开盘至收盘收益。其中按指数日内收益计算的多头择时是假设性结果。普通境内股票 ETF 实行 T+1,不能把“开盘买、当天收盘卖”直接当作可执行收益。本轮分别回答:
- 北京时间 08:45 前已完成的海外日线,能否改善 A 股指数预测?
- 按开盘价进入 ETF,并至少持有至下一次可交易开盘,这些信息是否改善多头/现金切换结果?
第二个持有窗口还包含一次隔夜,因此不等同于第一天的开盘至收盘收益。预测出开盘跳空,也不表示能在已经反映该跳空的开盘价之前成交。
时间与数据核查
信号时点固定为北京时间 08:45。每条海外行情先按本地时区换算为 UTC,再检查是否早于决策。美股使用纽约时区及其夏令时;香港取本地 16:10,日本按历史日期取 15:00/15:30,韩国统一取较保守的 15:30;之后均额外留一小时发布缓冲。正常全日收盘时间也保守覆盖提前收盘的半日市,但这并不独立证明源数据没有缺少交易日。NYSE 时间说明、香港交易时段、东京 2024 年交易时间变更。
TuShare 的 FXCM 外汇日线按 GMT 日期标记。本轮对美元兑离岸人民币、美元兑日元、欧元兑美元取买卖报价中间价,等 GMT 当天结束后再留一小时。因此前一个 GMT 日期的完整日线,假定到北京时间次日 09:00 才可用,不能用于 08:45 决策。这是有意保留的时间缓冲。TuShare 外汇日线定义。
海外信号使用相邻两次 A 股决策时点之间,最新可用收盘价的变化:A 股长假期间的海外涨跌会累计,海外休市时同一报价不会反复生成新涨跌。超过十个自然日的旧报价标为不可用。另设一组敏感性,把所有海外及汇率输入再延迟一个 A 股观测日。
| 核查 | 结果 |
|---|---|
| 各目标、各延迟情景累计的来源选择记录 | 148,568 条 |
| 假定可得时间晚于决策时间 | 0 条 |
| 已有历史抓取回执证明当时可得 | 0 条 |
| 超过十日的旧报价选择 | 377 条,相应特征不可用 |
| 外汇报价异常 | 剔除 2019-07-07 一条 USD/JPY 买卖倒挂报价 |
| ETF 行情与复权因子连接 | 每条行情均有对应因子 |
| 512480 多出的一条因子日期 | 2021-03-26,为已确认的份额拆分停牌日 |
这些核查证明的是假设时点下的先后关系,不是历史 API 准点率。 原始输入都是本次下载的最终历史数据,供应商在当时可能晚发、修订或缺失。没有补造历史抓取时间,因此尚不能认证为严格的历史可得数据回测,也没有新增前瞻观察期。
控制变量与年度滚动
每个模型都使用普通最小二乘回归,均值和标准差只从对应训练期计算;ETF 规则固定为预测收益大于零时持有,否则持有现金,没有按测试年收益调参。
- A 股自身+汇率: 前一期自身指数/ETF 收益、五期动量、二十期波动;前一期沪深 300 收益及五期动量;离岸人民币、日元、欧元汇率变化。
- 加入美股共同因素: 上述控制加 SPX。
- 加入亚洲盘面: 再加恒生、日经、韩国综合指数。
2020—2026 年逐年扩大训练窗口,每年单独拟合,至少要求 252 条先前有效训练样本。训练标签的结束时间必须早于该测试年的第一笔决策:例如前一年最后一笔 ETF 持有收益如果到新年开盘才结束,就会从训练集剔除。指数有七个年度切分;512480 在上市后积累足够训练数据,自 2021 年开始评估,共六个年度切分。2026 年均为截至 10 月的部分年份。
预测结果
以下增益为均方预测误差的降低幅度,计算式为 1 − 新模型 MSE / 基准 MSE,正值代表误差降低。它与第一轮“相对训练期平均值的 R²”不是同一个指标。置信区间对同一批样本的配对误差按十期循环时间块抽样,固定随机种子,重复 1,000 次;未对多项比较作整体显著性校正。
| 默认时间假设下的目标 | 样本数 | 全部海外信息相对“A 股+汇率” | 控制 SPX 后亚洲信息的增益及 95% 区间 | 亚洲增益为正的年份 |
|---|---|---|---|---|
| 沪深 300 开盘跳空 | 1,643 | +13.86% | +0.75% [−5.22%, +4.64%] | 2 / 7 |
| 申万半导体开盘跳空 | 1,643 | +11.92% | +1.16% [−1.67%, +3.34%] | 3 / 7 |
| 沪深 300 开盘至收盘 | 1,643 | +0.88% | −0.02% [−0.34%, +0.28%] | 2 / 7 |
| 申万半导体开盘至收盘 | 1,643 | +0.84% | +0.01% [−0.37%, +0.35%] | 3 / 7 |
| 510300 下一次可交易开盘 | 1,642 | −1.36% | −1.40% [−2.66%, −0.22%] | 1 / 7 |
| 512480 下一次可交易开盘 | 1,398 | +0.99% | −0.41% [−1.07%, +0.31%] | 2 / 6 |
再延迟一个 A 股观测日后,沪深 300 和半导体开盘跳空的亚洲增益分别变为 −1.63%、−1.42%,区间仍覆盖零;两只 ETF 对应为 −0.46%、−0.65%。公开汇总包含全部 36 项比较和 246 条分年结果,负面结果也保留。延迟情景显示信息对时间敏感,但不能据此倒推某个数据源实际晚到。
ETF 与成本
510300 提供宽基代理,512480 提供半导体代理。512480 的跟踪指数与本研究的申万半导体指数不同,不能把两者当作完全相同的组合;两只产品也是事后从存续产品中选择,没有完成历史全 ETF 股票池检验。
持有收益按 原始开盘价 × fund_adj 计算,避免把份额拆分当成突然亏损。涨跌停开盘保护也按拆分调整参照价。512480 在 2021-03-26 因拆分停牌,3 月 29 日复牌,对应一笔“下一次可交易开盘”间隔长于一个 A 股交易日;年化 Sharpe 仍采用 252 个观测间隔的近似。上交所拆分与停牌公告、ETF 交易规则常见问题、ETF 日线字段单位。
连续看多会保留原有持仓,成本只对买入、卖出和期末清仓收取。入场前检查此前二十个观测日的平均成交额,将 TuShare 的“千元”换算为元后,用固定参考金额的 1% 参与率上限判断;接近对应 10% 涨跌停的开盘价保守阻止相应方向的交易,卖出受阻则继续持仓。这只是在日线上的限制近似,不能证明开盘集合竞价真实成交。
| 默认时间假设、双边合计 10bp 成本 | A 股+汇率+SPX | 再加入亚洲三指数 | 始终持有 |
|---|---|---|---|
| 510300 每个观测间隔平均净收益 | +0.70bp | −2.58bp | +1.67bp |
| 510300 近似年化 Sharpe | 0.13 | −0.45 | 0.21 |
| 512480 每个观测间隔平均净收益 | +8.41bp | +7.17bp | +6.42bp |
| 512480 近似年化 Sharpe | 0.63 | 0.54 | 0.41 |
半导体的美股共同因素模型在这段历史中为正,但加入亚洲盘面后平均收益下降。这仍不足以投入生产:历史到数、ETF 选择、开盘成交及现金分配尚未完整核验。两只 ETF 的评估日期不同,也不能直接按上表高低比较产品优劣。
公开文件保留了 224 个成本情景,包括两种信息延迟、四种持仓规则、双边合计 0/5/10/20/40bp,以及 1 万/10 万/100 万元参考金额。在金额情景中,假设单边佣金 3bp、最低 5 元,再加单边 1/5/10bp 滑点;这些是研究假设,不是实测券商费率。参考金额固定用于费用与成交额准入,而收益会复利,因此不能将其解释为持续增长账户的实际容量。整手取整、盘口冲击、现金分红账本、期货换月及历史费率未完整回放。
复现与公开范围
在本仓锁定环境中运行:
PYTHONPATH=src python -m market_research.studies.overseas_leadlag.run \
  --index-inputs /external/index-histories \
  --extra-inputs /external/fx-and-etf-histories \
  --output /external/new-task-output
python scripts/export_overseas_leadlag_public.py \
  --input /external/new-task-output/reviewed_summary.json \
--output /external/reviewed-public-summary.json指数目录包括四份 {hsi,n225,ks11,spx}_tushare_daily.csv,以及 000300_sh_tushare_daily.csv、801081_si_sw_daily.csv。补充目录包括 {usdcnh,usdjpy,eurusd}_fxcm_fx_daily.csv 和 {510300,512480}_sh_{fund_daily,fund_adj}.csv。文件均需 trade_date,其余字段沿用对应 TuShare 接口,fund_daily.amount 为千元。输出必须是仓库外的新目录,保留输入 SHA-256、时间连接、训练区间、逐日预测及成本结果。
公开导出只允许汇总比较、分年结果、成本情景、训练边界及审计元数据。行情原始行、私有逐日预测、供应商凭据和本机路径不会进入公开投影。可选绘图脚本 scripts/plot_overseas_leadlag.py 用 Matplotlib 从汇总 JSON 生成图,不读取原始行情。
下一项能提升证据等级的工作,是在真正的前瞻期保留决策前抓取回执,再以集合竞价或分钟数据核对执行代理。本次发布保留当前历史结果和限制,尚不构成生产策略验收。