What happened when we let a CNN read price charts
Explore the CNN research topic and interactive chart →
Earlier experiments really did turn price history into pictures and produce predictions and backtest reports. An October 29, 2026 review recovered exported images from the public release, checked the competition project’s later diagnostics, and located another CNN archive on Linux. The evidence does not yet support deploying an image CNN to the competition account.
Start with the pictures. All performance figures below come from retained reports. This review did not retrain models or submit orders.
What the model sees
A price bar records a day’s open, high, low and close. These tiny grayscale pictures compress 20 trading days into one input, with volume bars along the bottom. A CNN learns local visual patterns and tries to relate them to a later return. A familiar shape does not guarantee the next outcome.
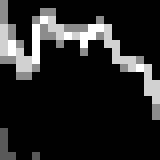
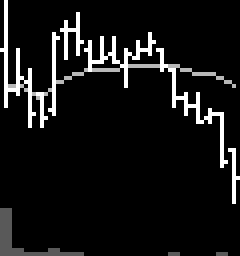
Both are actual PNG exports for Tencent with a July 15, 2004 cutoff, recovered from the June public release. Their experiments used different prediction horizons, so their different hindsight labels are not evidence that one model predicted better. The pictures have no original price coordinates; raw market tables are not distributed here.
Image attribution is to the FUTU Quant Lab public bundle, which records source revision acb8565. Market-data provenance and image redistribution rights have not been independently verified. Public availability does not establish permission to redistribute the full dataset; this retrospective shows only two existing normalized input pictures.
Three routes with similar names
| Route | Model input | What the current evidence establishes |
|---|---|---|
| Numeric CNN | Six features derived from daily OHLCV | A numeric signal and backtest pipeline runs |
| Image CNN | Grayscale price-chart windows | Actual images, predictions and historical reports exist; investment value remains unverified |
| Chronological numeric CNN | Train on earlier dates, then predict later dates | The competition diagnostic sample was too short for the unchanged training window |
cnn_walk_forward_rank is the third route. It uses numeric features, not the images above. Its temporal safeguards cannot be assumed to apply to the separate image implementation.
An out-of-sample test uses later observations that training has not seen. Showing performance on observations already used in training can make a model look better than it is.
Six CNN-related entries in the old project
The original strategy catalog lists six related entries. They share building blocks and are not six independent neural networks:
| Earlier entry | Plain-language description |
|---|---|
cnn_pattern | A CNN looks for patterns in numbers derived from prices and volume. |
cnn_pattern_mvp | The same numeric model with looser thresholds to test the pipeline. |
cnn_image_pattern | A CNN looks at pictures drawn from price bars. |
cnn_walk_forward_rank | Train in chronological segments and rank stocks in later periods. |
cnn_plus_sentiment | Add a sentiment filter to the basic numeric model’s signals. |
cnn_vol_regime | Add volatility-based risk and position sizing on top of CNN plus sentiment. |
The two image styles and choices of window and prediction horizon are experimental settings within the image approach. We did not find a validated, like-for-like scorecard for all six entries, so their names alone do not establish which performed best. See the original strategy catalog and CNN implementation guide.
What the June bundle preserved
The approximately 56 MB bundle explicitly includes data and research reports and excludes account data. It contains 32 exported chart inputs, image predictions, numeric CNN fold records and comparisons. The original project already exists locally. The release archive was retained in its owner’s private data directory; no duplicate clone or raw-data upload to this website was needed.
One image experiment covers 12 Hong Kong stocks, with portfolio records from January 2, 2018 to May 22, 2026. These are the archived report’s figures. Drawdowns are shown as positive loss magnitudes: a 59% drawdown means losing about six-tenths from a previous account high.
| Archived rule | Reported cumulative return | Reported maximum drawdown |
|---|---|---|
| Image CNN selecting the top five scores | +14.87% | 59.47% |
| Moving-average rule on the same universe | +91.70% | 34.73% |
| Momentum rule on the same universe | +2.31% | 42.65% |
Starting each simulated portfolio at 100
The chart uses every daily portfolio value in the old report, scaled to a common starting value of 100. The horizontal axis shows the year; the vertical axis shows simulated portfolio value. A value of 150 means an initial 100 would have become 150.
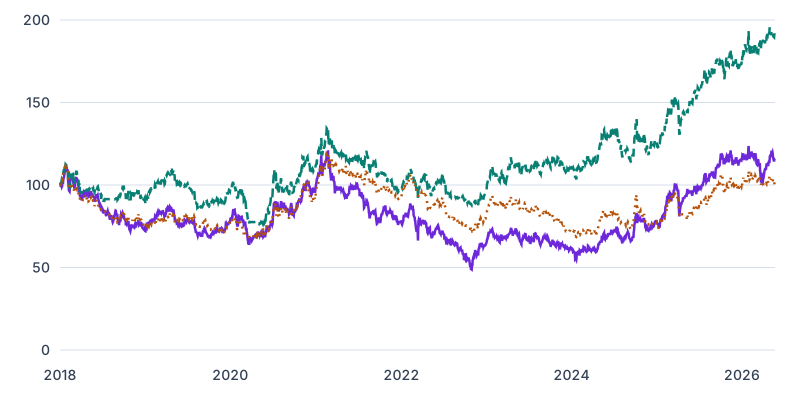
By May 22, 2026, an initial 100 would have become about 114.87 under image CNN, 191.70 under the moving-average rule, and 102.31 under momentum. The CNN curve also fell deeply along the way: its worst decline from an earlier high was about 59.47%. These are historical simulations, not actual competition-account returns, and do not guarantee future results.
These are cumulative returns over more than eight years, not annual returns. Trading frequency and exposure paths differ. Retained image-run positions imply 30 basis points of cost per turnover notional, about 30 currency units per 10,000 traded. This is a historical modeling assumption.
The prediction table carries year-based fold labels. A matching runner and complete fitted-model configuration were not recovered, so those labels do not establish the exact training cutoffs or absence of future-information leakage. Historical universe selection, adjustments and executable fills also remain unverified. These figures belong in an archival retrospective, not the validated-performance tables.
A separate 30-stock numeric CNN archive covers January 2, 2015 to May 22, 2026, a different period from the table above. It reports a top-five cumulative return of about -60.15% and maximum drawdown of 78.16%. Its original higher score threshold produced no positions. Loosening a threshold increased activity without automatically improving results.
What the competition project checked later
The fixed October 19, 2026 diagnostic had much narrower inputs: one selectable HK stock plus a benchmark ETF, and SPY alone for the US. This checks implementation behavior rather than ordinary cross-sectional stock selection.
Its image CNN reported +22.77% cumulative return for HK and +13.30% for the US. The relaxed numeric CNN had the same aggregate figures. This does not demonstrate an advantage from converting the inputs to pictures.
The standard image implementation predicts across a sample that includes training rows, which is why the snapshot labels its result an in-sample diagnostic. The separate chronological numeric model required 1,260 training sessions; the two available samples had only 727 and 751 sessions. No eligible test fold resulted.
The later research-evidence gate did not accept any of these 16 equity diagnostics. Historical results remain preserved alongside missing protocol, scope and input evidence. See the original diagnostic and research acceptance notes.
A separate Linux lead
A Linux cold archive contains another cnn2d_multimodal model checkpoint, two training-log entries and a factor-output file. That establishes the existence of prior CNN artifacts. Matching source and split documentation were not recovered, and a connection to FUTU Quant Lab is unproven. Its reported metrics are not mixed into this note.
A useful next experiment
Fix one universe and a genuinely unseen later period, then compare image CNN, numeric CNN and a simple moving-average control. Finish training before moving forward to predict. Record the chart cutoff, target period and information actually available at training time.
Choose image size and prediction horizon before looking at results. The two drawing styles above can become two explicit candidates rather than a search from which only the best score survives. Compare after consistent costs, exposure and turnover assumptions, using both return and drawdown.
Until that test is completed, these materials support research and teaching. There is no image CNN ready to hand off for competition-account execution.
Read further
- Original CNN implementation guide
- Public release with images and historical reports
- Competition historical aggregate snapshot
- Later equity prediction research
Source details for reproduction
The archive is chi-futu-quant-lab-bundle-20260616_124229.zip, SHA256 418ad65ffe059fc723d3f57b4668abc195bb5c63fdab5d6ff02ed7b320fe79a8. The 12-stock comparison comes from artifacts/reports/backtests/image_cnn_mvp/summary.csv; the 30-stock comparison comes from walk_forward_hk_cnn_mvp/summary.csv. The pictures are the first July 15, 2004 exports in cnn_image_samples and cnn_image_samples_paper_ohlc. Input pictures, historical returns and training-method evidence were checked separately; they do not form one fully bound run receipt.
The chart normalizes the three rules’ daily portfolio_daily.csv values and checks them against the reported returns and maximum drawdowns. Each rule’s retained positions_daily.csv records use a modeled cost of 0.3% of turnover. The generator is competition_tools.cnn_archive_performance.