cnn_pattern
A CNN looks for patterns in numbers derived from prices and volume.
Hong Kong research · Historical experiment
We recovered images and backtest records from earlier experiments. The image pipeline runs, but a stable advantage on unseen data remains unproven.
These are historical simulations, not actual competition-account returns. Training boundaries, stock selection and executable fills remain unverified.
01 / Hong Kong research · Historical experiment
Each image compresses 20 trading days. The model sees price shapes and volume, then tries to predict what follows. These two inputs were exported in the old release.

The original is only 20 × 20 pixels; enlargement makes the lines look blocky. Bars at the bottom show volume.
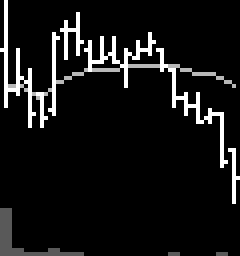
The vertical line spans the daily low and high. Left and right ticks mark open and close. The gray line is a moving average.
The two experiments used different prediction horizons, so their hindsight labels cannot establish which model performed better. Market-data provenance and image redistribution rights remain unverified.
02 / 2018–2026
The archived comparison covers 12 Hong Kong stocks from January 2, 2018 to May 22, 2026. A value of 150 means an initial 100 became 150. Choose a method or hover over the chart to inspect a day.
These are historical simulations, not actual competition-account returns. Training boundaries, stock selection and executable fills remain unverified.
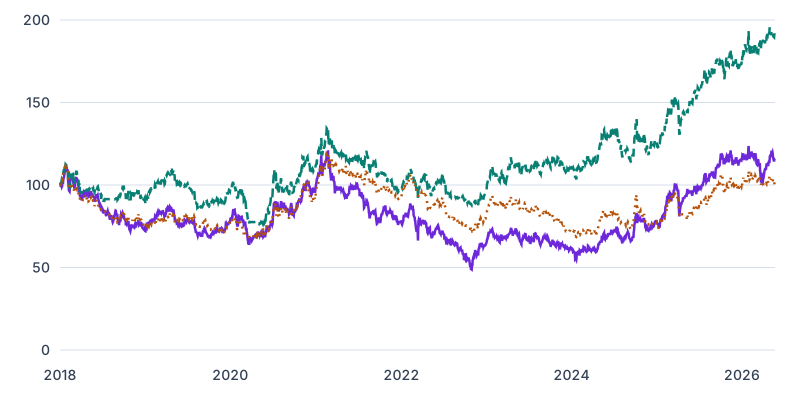
| Method | Ending value from 100 | Cumulative return | Maximum drawdown |
|---|---|---|---|
| Image CNN | 114.87 | +14.87% | 59.47% |
| Moving average | 191.70 | +91.70% | 34.73% |
| Momentum | 102.31 | +2.31% | 42.65% |
Image CNN ended around 114.87, but at one point fell 59.47% from a prior high. Moving average performed better in this report. The rules had different exposures and trading frequencies, so returns alone do not explain why.
The records model about 30 units of cost per 10,000 traded. Returns cover more than eight years and are not annual returns.
The prediction table has annual group labels, but the complete matching runner and configuration were not recovered. Training cutoffs, future information, historical universe, adjustments and executable fills remain unverified.
03 / CNN
The original project listed six related entries. Some share the same model and differ by thresholds or added rules.
cnn_patternA CNN looks for patterns in numbers derived from prices and volume.
cnn_pattern_mvpThe same numeric model with looser thresholds for testing the pipeline.
cnn_image_patternPrice windows are drawn as pictures for a CNN.
cnn_walk_forward_rankTrain on earlier data and rank stocks in later periods.
cnn_plus_sentimentAdd a sentiment filter to the basic CNN signals.
cnn_vol_regimeAdd volatility and risk controls to CNN plus sentiment.
The October 2026 diagnostic had small samples, and image-model predictions included training dates. The chronological numeric model had too little data for a complete test segment. These materials are useful for research demonstrations, but do not establish a competition-ready image CNN advantage.
The chart normalizes daily portfolio values from the public release and checks return and drawdown against its report. Input images, performance and training evidence were checked separately and do not constitute a complete receipt for one run.