Overseas signals and the A-share open
Opening forecasts improve mainly through the US market factor. After FX and SPX controls, the Asian basket adds little stable information.
The Asian increment is unstable across years and disappears with extra delay.
The CSI 300 and semiconductor opening-gap forecasts have only 2 of 7 and 3 of 7 positive annual Asian increments after SPX controls. ETF results also differ from opening forecasts: adding the Asian basket lowers both scheduled-input ETF models versus their SPX controls.
Historical availability is assumed, not verified
Zero historical retrieval vintages are verified. The 148,568 timing checks contain no future input under the assumed close-plus-one-hour policy, but cannot prove when the provider originally delivered each bar. Existing periods were previously inspected; these are retrospective folds.
Forecasts after FX and common-market controls
MSE gain is 1 − augmented error / baseline error. Positive is better. “All overseas” adds SPX and the three Asian indices to domestic + FX; “Asian increment” adds only the Asian basket after SPX. Brackets are descriptive 95% time-block intervals, without multiple-testing adjustment.
| Target / outcome | Observations | All overseas gain | Asian increment after SPX | Positive years |
|---|---|---|---|---|
| CSI 300 · opening gap | 1,643 | 13.86% | 0.75% [-5.22%, 4.64%] | 2 / 7 |
| CSI 300 · open to close | 1,643 | 0.88% | -0.02% [-0.34%, 0.28%] | 2 / 7 |
| SW semiconductor · opening gap | 1,643 | 11.92% | 1.16% [-1.67%, 3.34%] | 3 / 7 |
| SW semiconductor · open to close | 1,643 | 0.84% | 0.01% [-0.37%, 0.35%] | 3 / 7 |
| 510300 ETF · next tradable open | 1,642 | -1.36% | -1.40% [-2.66%, -0.22%] | 1 / 7 |
| 512480 ETF · next tradable open | 1,398 | 0.99% | -0.41% [-1.07%, 0.31%] | 2 / 6 |
Delay every external input by one more A-share observation
| Target / outcome | Observations | Asian increment after SPX |
|---|---|---|
| CSI 300 · opening gap | 1,633 | -1.63% [-4.77%, 1.17%] |
| CSI 300 · open to close | 1,633 | -0.41% [-1.30%, 0.45%] |
| SW semiconductor · opening gap | 1,633 | -1.42% [-3.32%, 0.43%] |
| SW semiconductor · open to close | 1,633 | -0.60% [-1.38%, 0.13%] |
| 510300 ETF · next tradable open | 1,632 | -0.46% [-1.79%, 0.47%] |
| 512480 ETF · next tradable open | 1,389 | -0.65% [-2.23%, 0.67%] |
Annual stability of the Asian increment
| Year | CSI 300 · opening gap | CSI 300 · open to close | SW semiconductor · opening gap | SW semiconductor · open to close | 510300 ETF · next tradable open | 512480 ETF · next tradable open |
|---|---|---|---|---|---|---|
| 2020 | -0.76% | -0.09% | 0.40% | 0.13% | -1.07% | — |
| 2021 | 3.77% | -0.11% | 1.48% | -0.14% | -2.79% | -0.18% |
| 2022 | -3.41% | 0.12% | -0.01% | -0.03% | -2.63% | 0.53% |
| 2023 | -3.17% | -0.49% | -0.99% | -1.11% | -1.14% | -1.12% |
| 2024 | 9.13% | -0.14% | 5.08% | -0.02% | -0.35% | -0.87% |
| 2025 | -8.89% | 0.76% | -1.26% | 0.51% | 0.64% | 0.08% |
| 2026 ≤ 10-16 | -9.70% | -0.04% | -0.13% | 0.21% | -4.72% | -0.66% |
T+1-compatible ETF exposure and costs
Correction to the first exploration: a same-day index open-to-close calculation is not an executable round trip for an ordinary domestic equity ETF, which is subject to T+1.
Long or cash at the open, with exit no earlier than the next tradable open; consecutive long signals retain holdings. Returns include an overnight interval. This is a daily-bar price proxy, not verified fills. 510300 covers 2020–2026; 512480 covers 2021–2026, with partial 2026.
| ETF | Exposure rule | Mean net return (bp / observed interval) | Approximate annualized Sharpe | Long exposure |
|---|---|---|---|---|
| 510300 | Domestic + FX + SPX | 0.70 | 0.13 | 67.60% |
| 510300 | Add Asian indices | -2.58 | -0.45 | 64.92% |
| 510300 | Always long | 1.67 | 0.21 | 100.00% |
| 512480 | Domestic + FX + SPX | 8.41 | 0.63 | 65.59% |
| 512480 | Add Asian indices | 7.17 | 0.54 | 64.38% |
| 512480 | Always long | 6.42 | 0.41 | 100.00% |
Cost sensitivity
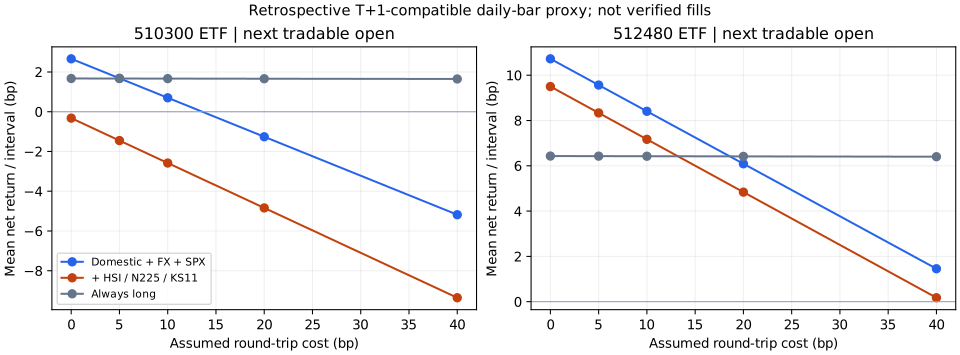
Select an ETF and input delay; hover or tap a point for exact values. Toggle rules in the legend. Lines connect reviewed cost assumptions, not a time series.
510300: 2020–2026, partial 2026 through October 16. Scheduled inputs (lag 0)
Mean net return (bp / observed interval). Cost assumptions vary across the horizontal axis; CNY 1m fixed reference notional. Historic daily-bar proxy returns are not verified fills.
Download static chart (SVG)Selected cost scenarios and sample sizes
| Total round-trip cost (bp) | Exposure rule | Mean net return (bp / observed interval) | Observed intervals |
|---|---|---|---|
| 0 | Domestic + FX | 2.1641 | 1642 |
| 0 | Domestic + FX + SPX | 2.6621 | 1642 |
| 0 | Add Asian indices | -0.3220 | 1642 |
| 0 | Always long | 1.6727 | 1642 |
| 5 | Domestic + FX | 1.2293 | 1642 |
| 5 | Domestic + FX + SPX | 1.6816 | 1642 |
| 5 | Add Asian indices | -1.4517 | 1642 |
| 5 | Always long | 1.6697 | 1642 |
| 10 | Domestic + FX | 0.2945 | 1642 |
| 10 | Domestic + FX + SPX | 0.7011 | 1642 |
| 10 | Add Asian indices | -2.5814 | 1642 |
| 10 | Always long | 1.6667 | 1642 |
| 20 | Domestic + FX | -1.5752 | 1642 |
| 20 | Domestic + FX + SPX | -1.2600 | 1642 |
| 20 | Add Asian indices | -4.8409 | 1642 |
| 20 | Always long | 1.6606 | 1642 |
| 40 | Domestic + FX | -5.3145 | 1642 |
| 40 | Domestic + FX + SPX | -5.1820 | 1642 |
| 40 | Add Asian indices | -9.3598 | 1642 |
| 40 | Always long | 1.6484 | 1642 |
Reference budget, minimum fee and slippage sensitivity
Asian-augmented model: assume a 3 bp one-way commission with a CNY 5 minimum, then 1/5/10 bp one-way slippage. Entry must fit 1% of prior 20-observation average turnover. Budgets are fixed reference notionals, not evolving account capacity. All 224 scenarios are downloadable.
| ETF | Reference amount (CNY) | One-way slippage (bp) | Mean net return (bp / observed interval) |
|---|---|---|---|
| 510300 | 10,000 | 1 | -3.03 |
| 510300 | 10,000 | 5 | -4.84 |
| 510300 | 10,000 | 10 | -7.10 |
| 510300 | 100,000 | 1 | -2.13 |
| 510300 | 100,000 | 5 | -3.94 |
| 510300 | 100,000 | 10 | -6.20 |
| 510300 | 1,000,000 | 1 | -2.13 |
| 510300 | 1,000,000 | 5 | -3.94 |
| 510300 | 1,000,000 | 10 | -6.20 |
| 512480 | 10,000 | 1 | 6.70 |
| 512480 | 10,000 | 5 | 4.84 |
| 512480 | 10,000 | 10 | 2.51 |
| 512480 | 100,000 | 1 | 7.64 |
| 512480 | 100,000 | 5 | 5.77 |
| 512480 | 100,000 | 10 | 3.44 |
| 512480 | 1,000,000 | 1 | 7.64 |
| 512480 | 1,000,000 | 5 | 5.77 |
| 512480 | 1,000,000 | 10 | 3.44 |
What still limits the conclusion
Historical source vintages and auction fills remain unverified. The ETFs were selected retrospectively and do not share identical evaluation windows; 512480 tracks a different index from the SW semiconductor target. One split suspension extends a holding interval. Cash distributions, whole-lot rounding, market impact and futures rolls are not fully replayed. 2026 is partial.