Liquidity, trading costs and capacity
Historical turnover describes trading activity; static books and execution models describe separate constraints. Actual portfolio capacity is not calibrated.
Four-market liquidity profiles have been recomputed on the shared date 2025-09-30. Historical windows now contain actual grouped observations; US data is unavailable in the 2026 window. Costs remain static measurements or execution simulations, not calibrated portfolio capacity.
Loading research data…
Loading research data…
Methods, source differences and independent checks
Source-specific filters are retrospective, not proof of historical availability.
| Market | Turnover / market value | Universe and limitations |
|---|---|---|
| US | Close × volume / close × shares outstanding | SimFin share-price universe; positive-price stocks including penny stocks. Dollar turnover is a closing-price proxy, not measured traded value. Historical share-class treatment is not independently verified. |
| HK | Reported HKD total_turnover / hk_total_market_val | RQData common stocks, using listing/delisting intervals and including delisted names in the supplied instrument snapshot. Complete historical-universe coverage is not proven. |
| A-share | amount × 1,000 CNY / total_mv × 10,000 CNY | TuShare SH/SZ daily-clean stocks; BSE and known predecessor codes excluded; prior observed ST/suspension flags. Reconstructed flags and source vintages do not establish historical PIT. |
| JP | Reported JPY Va / unadjusted C × dated Yahoo shares | Dated J-Quants domestic-equity market codes; excludes Others and TOKYO PRO. Yahoo share history is exploratory and incomplete, with unverified revision and share-class history. |
Independent aggregate review: 1520 · Raw-source window checks: 48
The aggregate review counts security-day entries across publication views; some views overlap. It is not a count of unique raw rows independently audited.
Where the 960 missing minutes occurred
In the saved 2026-04-16 sample, all 80 Shenzhen stocks lack snapshots at 09:32–09:36 and 09:54–10:00: 80 × 12 = 960 security-minutes. The 62 Shanghai stocks have full sampled coverage. The upstream cause remains unverified.
A-share trading costs and capacity
How much predicted return survives execution, and how does this change with capital and turnover?
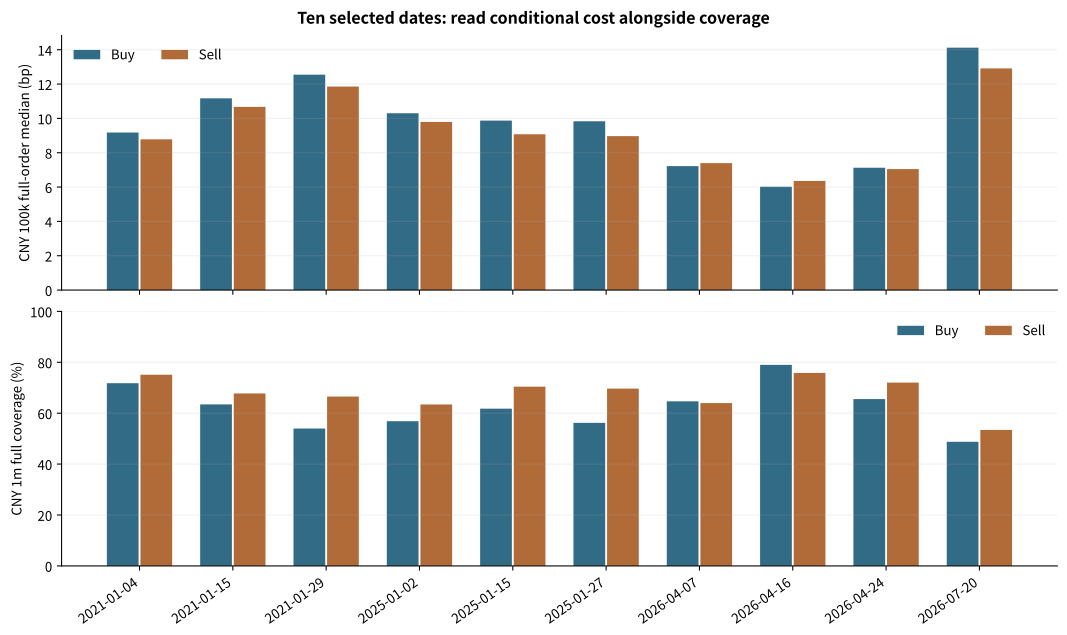
Across ten selected dates, median static buy/sell costs at CNY 100k are 9.27/8.87 bp. At CNY 1m, full ten-level coverage is only 62.12%/67.68%.
Ten predeclared dates in 2021, 2025 and 2026; 306,483 valid two-sided security-minute books. Order-flow association and a 56-session strategy diagnostic are reported separately. Costs are equal-weighted across fully covered records; actual orders and dynamic impact remain uncalibrated.
Expanded snapshot evidence and strategy diagnostics
Ten predeclared dates test displayed liquidity. Costs are conditional on filling the whole order within ten displayed levels; read them together with coverage and sample counts.
A static book does not establish a fill, market impact, or executable capacity. Order-flow association has not passed the dynamic replay gate.
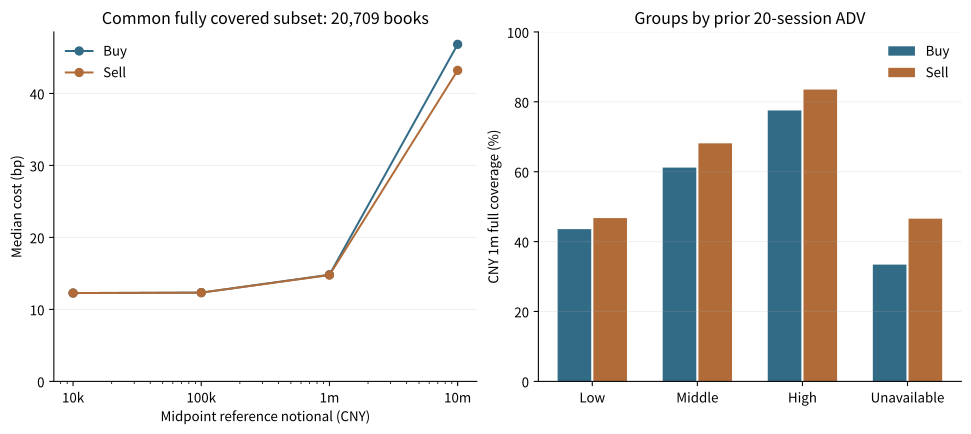
1 bp equals 0.01%. Costs use the contemporaneous midpoint and include half-spread and displayed-depth consumption; fees, latency, replenishment, queues and own-order impact are excluded. Coverage divides fully covered orders by all valid two-sided books.
P50 (bp) · P90 (bp)
Selected values and sample counts
| Date / group | P50 (bp) | P90 (bp) | Full coverage | Eligible books | Fully covered orders |
|---|---|---|---|---|---|
| 2021-01-04 | 9.18 | 23.9 | 99.98% | 25,350 | 25,344 |
| 2021-01-15 | 11.17 | 29.68 | 99.86% | 25,833 | 25,797 |
| 2021-01-29 | 12.55 | 35.91 | 99.67% | 25,840 | 25,755 |
| 2025-01-02 | 10.3 | 27.6 | 99.72% | 32,751 | 32,658 |
| 2025-01-15 | 9.87 | 26.64 | 99.90% | 32,985 | 32,953 |
| 2025-01-27 | 9.83 | 26.11 | 99.79% | 32,791 | 32,721 |
| 2026-04-07 | 7.22 | 17.88 | 99.94% | 32,861 | 32,841 |
| 2026-04-16 | 6.02 | 14.87 | 99.98% | 32,341 | 32,335 |
| 2026-04-24 | 7.13 | 18.66 | 99.97% | 33,186 | 33,175 |
| 2026-07-20 | 14.12 | 47.71 | 98.10% | 32,545 | 31,928 |
Full evidence tables
| Date / group | Side | Eligible books | Fully covered orders at 100,000 yuan | 100,000 yuan full-order median (bp) | 100,000 yuan full-order p90 (bp) | 1 million yuan full coverage |
|---|---|---|---|---|---|---|
| 2021-01-04 | Buy | 25,350 | 25,344 | 9.18 | 23.9 | 71.80% |
| 2021-01-04 | Sell | 25,350 | 25,338 | 8.78 | 22.78 | 75.11% |
| 2021-01-15 | Buy | 25,833 | 25,797 | 11.17 | 29.68 | 63.45% |
| 2021-01-15 | Sell | 25,833 | 25,825 | 10.67 | 26.28 | 67.76% |
| 2021-01-29 | Buy | 25,840 | 25,755 | 12.55 | 35.91 | 53.97% |
| 2021-01-29 | Sell | 25,840 | 25,826 | 11.86 | 29.63 | 66.54% |
| 2025-01-02 | Buy | 32,751 | 32,658 | 10.3 | 27.6 | 56.87% |
| 2025-01-02 | Sell | 32,751 | 32,716 | 9.79 | 25.13 | 63.43% |
| 2025-01-15 | Buy | 32,985 | 32,953 | 9.87 | 26.64 | 61.78% |
| 2025-01-15 | Sell | 32,985 | 32,977 | 9.07 | 22.44 | 70.42% |
| 2025-01-27 | Buy | 32,791 | 32,721 | 9.83 | 26.11 | 56.21% |
| 2025-01-27 | Sell | 32,791 | 32,778 | 8.97 | 21.99 | 69.66% |
| 2026-04-07 | Buy | 32,861 | 32,841 | 7.22 | 17.88 | 64.66% |
| 2026-04-07 | Sell | 32,861 | 32,811 | 7.39 | 19.58 | 63.97% |
| 2026-04-16 | Buy | 32,341 | 32,335 | 6.02 | 14.87 | 78.99% |
| 2026-04-16 | Sell | 32,341 | 32,337 | 6.36 | 15.49 | 75.82% |
| 2026-04-24 | Buy | 33,186 | 33,175 | 7.13 | 18.66 | 65.55% |
| 2026-04-24 | Sell | 33,186 | 33,178 | 7.05 | 17.81 | 72.03% |
| 2026-07-20 | Buy | 32,545 | 31,928 | 14.12 | 47.71 | 48.76% |
| 2026-07-20 | Sell | 32,545 | 32,372 | 12.91 | 37.13 | 53.42% |
Liquidity group comparison
P50 (bp) · P90 (bp)
Selected values and sample counts
| Date / group | P50 (bp) | P90 (bp) | Full coverage | Eligible books | Fully covered orders |
|---|---|---|---|---|---|
| High | 6.15 | 17.27 | 99.97% | 115,762 | 115,729 |
| Low | 14.22 | 40.14 | 99.25% | 87,180 | 86,528 |
| Middle | 9.81 | 25.19 | 99.72% | 101,060 | 100,773 |
| Unavailable | 6.99 | 22.44 | 99.84% | 2,481 | 2,477 |
Full evidence tables
| Date / group | Side | Eligible books | Fully covered orders at 100,000 yuan | 100,000 yuan full-order median (bp) | 100,000 yuan full-order p90 (bp) | 1 million yuan full coverage |
|---|---|---|---|---|---|---|
| High | Buy | 115,762 | 115,729 | 6.15 | 17.27 | 77.53% |
| High | Sell | 115,762 | 115,728 | 5.97 | 16.9 | 83.52% |
| Low | Buy | 87,180 | 86,528 | 14.22 | 40.14 | 43.56% |
| Low | Sell | 87,180 | 86,944 | 13.31 | 33.45 | 46.73% |
| Middle | Buy | 101,060 | 100,773 | 9.81 | 25.19 | 61.18% |
| Middle | Sell | 101,060 | 101,005 | 9.23 | 22.4 | 68.11% |
| Unavailable | Buy | 2,481 | 2,477 | 6.99 | 22.44 | 33.41% |
| Unavailable | Sell | 2,481 | 2,481 | 6.35 | 19.78 | 46.55% |
Market value, volatility and time-of-day groups
Circulating market value
| Date / group | Side | Eligible books | Fully covered orders at 100,000 yuan | 100,000 yuan full-order median (bp) | 100,000 yuan full-order p90 (bp) | 1 million yuan full coverage |
|---|---|---|---|---|---|---|
| High | Buy | 108,463 | 108,408 | 6.55 | 16.29 | 79.82% |
| High | Sell | 108,463 | 108,438 | 6.37 | 15.34 | 84.93% |
| Low | Buy | 83,301 | 82,670 | 13.46 | 40.09 | 36.53% |
| Low | Sell | 83,301 | 83,076 | 12.66 | 32.99 | 40.41% |
| Middle | Buy | 114,719 | 114,429 | 10.4 | 27.13 | 63.96% |
| Middle | Sell | 114,719 | 114,644 | 9.83 | 24.27 | 71.16% |
Volatility
| Date / group | Side | Eligible books | Fully covered orders at 100,000 yuan | 100,000 yuan full-order median (bp) | 100,000 yuan full-order p90 (bp) | 1 million yuan full coverage |
|---|---|---|---|---|---|---|
| High | Buy | 94,805 | 94,679 | 8.55 | 25.12 | 59.51% |
| High | Sell | 94,805 | 94,739 | 7.99 | 22.66 | 66.74% |
| Low | Buy | 106,269 | 105,986 | 9.27 | 25.71 | 70.28% |
| Low | Sell | 106,269 | 106,179 | 8.97 | 23.01 | 74.69% |
| Middle | Buy | 102,928 | 102,365 | 10.02 | 29.75 | 56.79% |
| Middle | Sell | 102,928 | 102,759 | 9.62 | 25.9 | 61.81% |
| Unavailable | Buy | 2,481 | 2,477 | 6.99 | 22.44 | 33.41% |
| Unavailable | Sell | 2,481 | 2,481 | 6.35 | 19.78 | 46.55% |
Time of day
| Date / group | Side | Eligible books | Fully covered orders at 100,000 yuan | 100,000 yuan full-order median (bp) | 100,000 yuan full-order p90 (bp) | 1 million yuan full coverage |
|---|---|---|---|---|---|---|
| 13:00–13:59 | Buy | 77,611 | 77,270 | 9.22 | 26.7 | 60.71% |
| 13:00–13:59 | Sell | 77,611 | 77,535 | 8.67 | 22.21 | 69.45% |
| 14:00–14:56 | Buy | 73,432 | 73,275 | 8.49 | 25.36 | 66.56% |
| 14:00–14:56 | Sell | 73,432 | 73,361 | 8.35 | 22.84 | 69.08% |
| 10:00–11:29 | Buy | 117,023 | 116,645 | 9.32 | 25.84 | 62.36% |
| 10:00–11:29 | Sell | 117,023 | 116,911 | 8.99 | 23.67 | 67.92% |
| 09:30–09:59 | Buy | 38,417 | 38,317 | 10.96 | 32.67 | 55.76% |
| 09:30–09:59 | Sell | 38,417 | 38,351 | 10.7 | 30.68 | 60.66% |
Sample and missing-minute audit
Expected minute bins use 237 continuous-session minutes for each security observed on that date, not all historically eligible stocks.
| Date / group | Securities | Snapshots | Valid books | One-sided books | Expected security-minutes | Observed security-minutes | Missing security-minutes |
|---|---|---|---|---|---|---|---|
| 2021-01-04 | 110 | 26,070 | 25,350 | 720 | 26,070 | 26,070 | 0 |
| 2021-01-15 | 110 | 26,070 | 25,833 | 237 | 26,070 | 26,070 | 0 |
| 2021-01-29 | 110 | 26,070 | 25,840 | 230 | 26,070 | 26,070 | 0 |
| 2025-01-02 | 139 | 32,943 | 32,751 | 192 | 32,943 | 32,943 | 0 |
| 2025-01-15 | 140 | 33,178 | 32,985 | 193 | 33,180 | 33,178 | 2 |
| 2025-01-27 | 140 | 33,177 | 32,791 | 386 | 33,180 | 33,177 | 3 |
| 2026-04-07 | 142 | 33,651 | 32,861 | 790 | 33,654 | 33,651 | 3 |
| 2026-04-16 | 142 | 32,694 | 32,341 | 353 | 33,654 | 32,694 | 960 |
| 2026-04-24 | 143 | 33,889 | 33,186 | 703 | 33,891 | 33,889 | 2 |
| 2026-07-20 | 142 | 33,653 | 32,545 | 1,108 | 33,654 | 33,653 | 1 |
56-session strategy diagnostic, January–March 2025
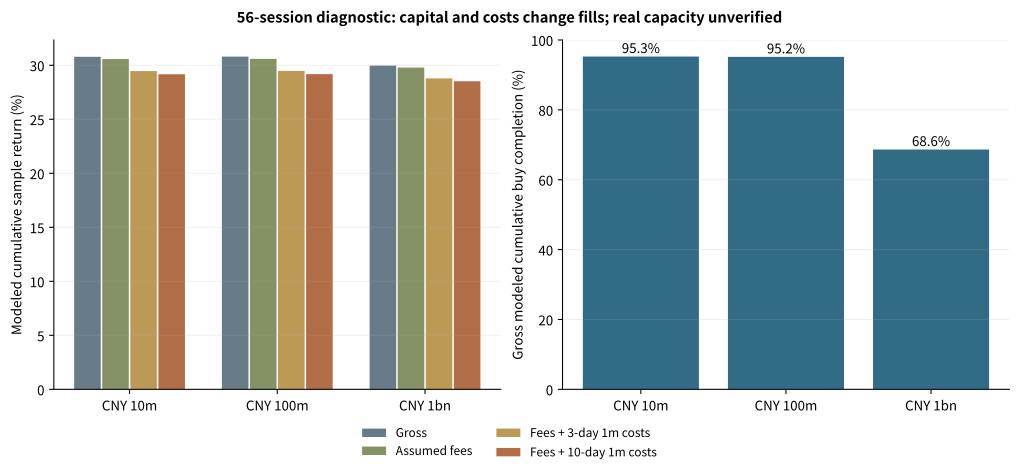
The model uses a 5% daily-amount participation limit, T+1 and price-limit checks. Fractional shares and adjusted-close proxies simplify fills. Cost references include later 2026 observations and are counterfactual assumptions, not an ex-ante 2025 model or stock/time calibration. Original release times, corporate actions and delisting settlement remain unverified. These results do not establish real capacity or net alpha.
Fee sensitivity assumes 1 bp inclusive commission per side and 5 bp seller stamp duty, with zero minimum commission and no extra transfer fee. Static costs replace cash debits; the original 5 bp simulator charge is removed.
P50 (bp) · P90 (bp)
Selected values and sample counts
| Scenario | Terminal NAV | Transaction costs (yuan) |
|---|---|---|
| Gross | 1.307825 | 0 |
| Assumed fees | 1.305736 | 19,385.28 |
| Assumed fees + expanded 100,000-yuan order costs | 1.299470 | 76,059.66 |
| Assumed fees + expanded 1-million-yuan order costs | 1.291617 | 147,021.75 |
Full evidence tables
| Capital (yuan) | Scenario | Terminal NAV | Transaction costs (yuan) | Mean one-way turnover |
|---|---|---|---|---|
| 10,000,000 | Gross | 1.307825 | 0 | 4.74% |
| 10,000,000 | Assumed fees | 1.305736 | 19,385.28 | 4.74% |
| 10,000,000 | Assumed fees + borrowed 10,000-yuan order costs | 1.301970 | 53,467.48 | 4.73% |
| 10,000,000 | Assumed fees + borrowed 1-million-yuan order costs | 1.294591 | 120,229.65 | 4.73% |
| 10,000,000 | Assumed fees + expanded 100,000-yuan order costs | 1.299470 | 76,059.66 | 4.73% |
| 10,000,000 | Assumed fees + expanded 1-million-yuan order costs | 1.291617 | 147,021.75 | 4.73% |
| 100,000,000 | Gross | 1.307982 | 0 | 4.74% |
| 100,000,000 | Assumed fees | 1.305893 | 193,873.16 | 4.74% |
| 100,000,000 | Assumed fees + borrowed 10,000-yuan order costs | 1.302125 | 534,729.95 | 4.73% |
| 100,000,000 | Assumed fees + borrowed 1-million-yuan order costs | 1.294743 | 1,202,429.3 | 4.73% |
| 100,000,000 | Assumed fees + expanded 100,000-yuan order costs | 1.299624 | 760,676.24 | 4.73% |
| 100,000,000 | Assumed fees + expanded 1-million-yuan order costs | 1.291767 | 1,470,383.4 | 4.73% |
| 1,000,000,000 | Gross | 1.299669 | 0 | 4.31% |
| 1,000,000,000 | Assumed fees | 1.297823 | 1,737,084.98 | 4.31% |
| 1,000,000,000 | Assumed fees + borrowed 10,000-yuan order costs | 1.294446 | 4,834,404.61 | 4.31% |
| 1,000,000,000 | Assumed fees + borrowed 1-million-yuan order costs | 1.287818 | 10,911,056.01 | 4.31% |
| 1,000,000,000 | Assumed fees + expanded 100,000-yuan order costs | 1.292200 | 6,890,870.45 | 4.31% |
| 1,000,000,000 | Assumed fees + expanded 1-million-yuan order costs | 1.285138 | 13,358,126.6 | 4.31% |
Unfilled amounts sum order records, rather than measuring terminal backlog.
| Capital (yuan) | Scenario | Unfilled buys (yuan) | Unfilled sells (yuan) | Negative-cash sessions |
|---|---|---|---|---|
| 10,000,000 | Gross | 1,805,307.29 | 1,627,190.04 | 0 |
| 10,000,000 | Assumed fees | 1,819,976.76 | 1,625,479.3 | 0 |
| 10,000,000 | Assumed fees + borrowed 10,000-yuan order costs | 1,842,605.39 | 1,622,184.18 | 0 |
| 10,000,000 | Assumed fees + borrowed 1-million-yuan order costs | 1,887,295.92 | 1,615,719.67 | 0 |
| 10,000,000 | Assumed fees + expanded 100,000-yuan order costs | 1,857,490.04 | 1,619,987.1 | 0 |
| 10,000,000 | Assumed fees + expanded 1-million-yuan order costs | 1,904,796.48 | 1,613,085.34 | 0 |
| 100,000,000 | Gross | 18,432,212.47 | 16,379,583.85 | 0 |
| 100,000,000 | Assumed fees | 18,576,511.12 | 16,362,267.05 | 0 |
| 100,000,000 | Assumed fees + borrowed 10,000-yuan order costs | 18,798,942.6 | 16,328,863.83 | 0 |
| 100,000,000 | Assumed fees + borrowed 1-million-yuan order costs | 19,238,284.76 | 16,263,328.86 | 0 |
| 100,000,000 | Assumed fees + expanded 100,000-yuan order costs | 18,945,245.13 | 16,306,589.42 | 0 |
| 100,000,000 | Assumed fees + expanded 1-million-yuan order costs | 19,410,605.33 | 16,236,618.28 | 0 |
| 1,000,000,000 | Gross | 1,525,456,846.33 | 455,103,527 | 0 |
| 1,000,000,000 | Assumed fees | 1,524,467,234.48 | 454,407,518.21 | 0 |
| 1,000,000,000 | Assumed fees + borrowed 10,000-yuan order costs | 1,521,968,026.39 | 453,004,517.3 | 0 |
| 1,000,000,000 | Assumed fees + borrowed 1-million-yuan order costs | 1,517,058,712.89 | 450,247,655.13 | 0 |
| 1,000,000,000 | Assumed fees + expanded 100,000-yuan order costs | 1,520,278,064.68 | 452,065,889.57 | 0 |
| 1,000,000,000 | Assumed fees + expanded 1-million-yuan order costs | 1,514,987,296.46 | 449,114,890.63 | 0 |
Download aggregate evidence (expansion)Download aggregate evidence (strategy)
Early and recent common-sample comparison
The common-security comparison still has different minute coverage. Paired results use only security-minutes with valid books on both dates; neither comparison isolates a market-wide time trend. Common securities also condition on survival.
In the 106 common securities, observed minute coverage is 100% on 2021-01-04 and 96.99% on 2026-04-16. Earlier Shanghai trades have no corresponding order records in this selected sample; Shenzhen order-ID match rates are 99.68%/99.75%. More complete book minutes do not establish more complete event streams.
| Common securities | Paired valid security-minutes |
|---|---|
| 106 | 23,297 |
Full evidence tables
| Date / group | Expected security-minutes | Observed security-minutes | Missing security-minutes |
|---|---|---|---|
| 2021-01-04 | 25,122 | 25,122 | 0 |
| 2026-04-16 | 25,122 | 24,366 | 756 |
| Date / group | Side | Eligible books | Fully covered orders at 100,000 yuan | 100,000 yuan full-order median (bp) | 100,000 yuan full-order p90 (bp) | 1 million yuan full coverage |
|---|---|---|---|---|---|---|
| 2021-01-04 | Buy | 24,402 | 24,396 | 9.18 | 24.03 | 71.06% |
| 2021-01-04 | Sell | 24,402 | 24,390 | 8.79 | 22.78 | 75.11% |
| 2026-04-16 | Buy | 24,013 | 24,011 | 6.14 | 14.1 | 88.75% |
| 2026-04-16 | Sell | 24,013 | 24,011 | 6.33 | 14.18 | 85.58% |
Paired valid-minute results
| Date / group | Side | Eligible books | Fully covered orders at 100,000 yuan | 100,000 yuan full-order median (bp) | 100,000 yuan full-order p90 (bp) | 1 million yuan full coverage |
|---|---|---|---|---|---|---|
| 2021-01-04 | Buy | 23,297 | 23,293 | 8.98 | 23.75 | 72.17% |
| 2021-01-04 | Sell | 23,297 | 23,285 | 8.76 | 22.78 | 76.35% |
| 2026-04-16 | Buy | 23,297 | 23,295 | 6.04 | 14.1 | 89.16% |
| 2026-04-16 | Sell | 23,297 | 23,295 | 6.29 | 14.18 | 85.17% |
Order and trade quality gates
The 2021 clock is milliseconds relative to 09:30, retaining lunch; 2026 native clocks use HHMMSSmmm. Name aliases alone do not convert clocks.
Earlier reference keys use security and order ID; native keys also use channel. Matching is candidate-key presence, not authenticated order semantics. Zero business indexes are reported separately from positive sequence regressions.
A static book does not establish a fill, market impact, or executable capacity. Order-flow association has not passed the dynamic replay gate.
| Date / group | Scenario | Rows | Nonpositive prices | Duplicate events | Timestamp regressions | Nonpositive sequence rows | Positive-sequence regressions |
|---|---|---|---|---|---|---|---|
| 2021-01-04 | Orders | 1,506,074 | 0 | 0 | 0 | — | — |
| 2021-01-04 | Trades | 1,596,501 | 0 | 0 | 0 | — | — |
| 2021-01-04 | Positive-price trades | 1,596,501 | 0 | 0 | 0 | — | — |
| 2026-04-16 | Orders | 6,787,780 | 5,320 | 0 | 0 | 3,590,754 | 0 |
| 2026-04-16 | Trades | 4,189,318 | 715,285 | 0 | 91,007 | 2,571,122 | 22,694 |
| 2026-04-16 | Positive-price trades | 3,474,033 | 0 | 0 | 64,245 | 1,855,837 | 22,694 |
| Date / group | Reference candidate | Side | Reference match rate | Ambiguous references |
|---|---|---|---|---|
| 2021-01-04 | OrderID | Buy | 52.33% | 19,987 |
| 2021-01-04 | OrderID | Sell | 52.37% | 23,079 |
| 2026-04-16 | OrderID | Buy | 79.72% | 64,479 |
| 2026-04-16 | OrderID | Sell | 79.18% | 67,166 |
| 2026-04-16 | DBOrderID | Buy | 0.18% | 0 |
| 2026-04-16 | DBOrderID | Sell | 0.19% | 0 |
| Date / group | Market | Orders | Positive-price trade rows | Reference candidate | Side | Reference match rate |
|---|---|---|---|---|---|---|
| 2021-01-04 | Shanghai | 0 | 758,422 | OrderID | Buy | 0.00% |
| 2021-01-04 | Shanghai | 0 | 758,422 | OrderID | Sell | 0.00% |
| 2021-01-04 | Shenzhen | 1,506,074 | 838,079 | OrderID | Buy | 99.68% |
| 2021-01-04 | Shenzhen | 1,506,074 | 838,079 | OrderID | Sell | 99.75% |
| 2026-04-16 | Shanghai | 3,197,026 | 1,618,196 | OrderID | Buy | 56.45% |
| 2026-04-16 | Shanghai | 3,197,026 | 1,618,196 | OrderID | Sell | 55.30% |
| 2026-04-16 | Shanghai | 3,197,026 | 1,618,196 | DBOrderID | Buy | 0.39% |
| 2026-04-16 | Shanghai | 3,197,026 | 1,618,196 | DBOrderID | Sell | 0.40% |
| 2026-04-16 | Shenzhen | 3,590,754 | 1,855,837 | OrderID | Buy | 100.00% |
| 2026-04-16 | Shenzhen | 3,590,754 | 1,855,837 | OrderID | Sell | 100.00% |
| 2026-04-16 | Shenzhen | 3,590,754 | 1,855,837 | DBOrderID | Buy | 0.00% |
| 2026-04-16 | Shenzhen | 3,590,754 | 1,855,837 | DBOrderID | Sell | 0.00% |
Minute execution diagnostic: 40 main-board securities
The second half of 2024 and full year 2025 start independently with cash. Their different lengths prevent annual return rankings. This public 40-security main-board sample differs from the earlier 400-security micro-cap / 56-session diagnostic; the results cannot be compared directly.
Full-year 2024 remains unpublished. Reviewed cross-source evidence permits a trial of raw-price accounting without changing adjustment factors. The CNY 1m and CNY 10m fee pilots are incomplete: three held delisted securities (600321, 002621 and 000982) lack supported valuation or disposition proceeds from their delisting dates. Holdings cannot be removed, valued at zero or carried at their last price to fill this gap. Vendor factor internals and historical revisions remain unverified.
Separate assumption-based studies retain delisted shares and change valuation without creating disposal cash. They do not resolve the strict annual evidence gap or replace the 18 scenarios below.
Retrospective validation: the CNY1 price guard improved the assumption-based 2024 account but changed no 2025 fills. Across 24 scenario records (12 simulations and 12 verified ledger reuses), higher returns sometimes coincide with lower completion. These results do not establish live capacity.
2024-07-01 – 2024-12-31
Maximum calendar staleness (days): 7
| Sessions | Observed minute bars | Synthetic suspension marks | Corporate events |
|---|---|---|---|
| 125 | 2,466,153 | 17 | 9 |
| Scenario | Capital (CNY) | Terminal NAV | Mean one-way turnover | Target-notional completion | Arrival shortfall P90 (bp) |
|---|---|---|---|---|---|
| CNY 1m · gross | 1,000,000 | 1.7221 | 6.27% | 97.52% | 198.54 |
| CNY 1m · fees | 1,000,000 | 1.7122 | 6.27% | 97.52% | 204.29 |
| CNY 10m · fees | 10,000,000 | 1.7159 | 6.28% | 96.27% | 187.45 |
| CNY 100m · fees | 100,000,000 | 1.7205 | 5.33% | 67.64% | 210.71 |
| CNY 10m · faster release | 10,000,000 | 1.7310 | 5.98% | 86.81% | 188.35 |
| CNY 10m · split release | 10,000,000 | 1.7146 | 6.08% | 89.71% | 276.89 |
| CNY 10m · weekly rebalance | 10,000,000 | 1.6863 | 2.72% | 97.21% | 184.4 |
| CNY 10m · rebalance buffer | 10,000,000 | 1.6905 | 1.32% | 96.96% | 184.41 |
| CNY 1m · minimum commission | 1,000,000 | 1.6945 | 6.26% | 97.50% | 292.61 |
Orders, costs and missing cost references
| Scenario | Transaction costs (CNY) | Orders without cost reference | Orders | Zero-fill orders | Partial-fill orders |
|---|---|---|---|---|---|
| CNY 1m · gross | 0 | 0 | 3,313 | 112 | 24 |
| CNY 1m · fees | 7,374.43 | 0 | 3,303 | 114 | 23 |
| CNY 10m · fees | 73,623.99 | 0 | 4,986 | 20 | 40 |
| CNY 100m · fees | 616,079.31 | 0 | 5,319 | 24 | 750 |
| CNY 10m · faster release | 70,164.13 | 9 | 5,026 | 64 | 349 |
| CNY 10m · split release | 70,816.2 | 9 | 5,023 | 56 | 505 |
| CNY 10m · weekly rebalance | 30,286.14 | 0 | 1,079 | 3 | 21 |
| CNY 10m · rebalance buffer | 13,400.88 | 0 | 1,009 | 2 | 11 |
| CNY 1m · minimum commission | 21,096.02 | 0 | 3,298 | 112 | 23 |
| Scenario | Release horizon (elapsed minutes) | Release slices | Minimum commission (CNY / parent) | Negative-cash sessions |
|---|---|---|---|---|
| CNY 1m · gross | 330 | 1 | 0 | 0 |
| CNY 1m · fees | 330 | 1 | 0 | 0 |
| CNY 10m · fees | 330 | 1 | 0 | 0 |
| CNY 100m · fees | 330 | 1 | 0 | 0 |
| CNY 10m · faster release | 30 | 1 | 0 | 0 |
| CNY 10m · split release | 120 | 5 | 0 | 0 |
| CNY 10m · weekly rebalance | 330 | 1 | 0 | 0 |
| CNY 10m · rebalance buffer | 330 | 1 | 0 | 0 |
| CNY 1m · minimum commission | 330 | 1 | 5 | 0 |
2025-01-02 – 2025-12-31
Maximum calendar staleness (days): 22
| Sessions | Observed minute bars | Synthetic suspension marks | Corporate events |
|---|---|---|---|
| 243 | 6,178,999 | 111 | 28 |
| Scenario | Capital (CNY) | Terminal NAV | Mean one-way turnover | Target-notional completion | Arrival shortfall P90 (bp) |
|---|---|---|---|---|---|
| CNY 1m · gross | 1,000,000 | 1.7144 | 4.67% | 95.19% | 169.56 |
| CNY 1m · fees | 1,000,000 | 1.7028 | 4.66% | 95.19% | 171.22 |
| CNY 10m · fees | 10,000,000 | 1.7263 | 4.69% | 94.38% | 153.08 |
| CNY 100m · fees | 100,000,000 | 1.8289 | 3.93% | 69.45% | 154.85 |
| CNY 10m · faster release | 10,000,000 | 1.7408 | 4.44% | 86.07% | 151.64 |
| CNY 10m · split release | 10,000,000 | 1.7403 | 4.55% | 88.80% | 225.27 |
| CNY 10m · weekly rebalance | 10,000,000 | 1.8508 | 2.25% | 95.09% | 152.8 |
| CNY 10m · rebalance buffer | 10,000,000 | 1.7208 | 0.99% | 92.79% | 153.37 |
| CNY 1m · minimum commission | 1,000,000 | 1.6749 | 4.65% | 95.12% | 246.68 |
Orders, costs and missing cost references
| Scenario | Transaction costs (CNY) | Orders without cost reference | Orders | Zero-fill orders | Partial-fill orders |
|---|---|---|---|---|---|
| CNY 1m · gross | 0 | 0 | 4,931 | 100 | 23 |
| CNY 1m · fees | 10,569.69 | 0 | 4,834 | 95 | 23 |
| CNY 10m · fees | 107,661.42 | 0 | 9,279 | 97 | 75 |
| CNY 100m · fees | 934,448.54 | 0 | 10,208 | 83 | 869 |
| CNY 10m · faster release | 102,299.58 | 36 | 9,319 | 197 | 317 |
| CNY 10m · split release | 104,895.31 | 38 | 9,368 | 130 | 601 |
| CNY 10m · weekly rebalance | 52,005.89 | 0 | 2,101 | 29 | 40 |
| CNY 10m · rebalance buffer | 20,487.29 | 0 | 1,939 | 33 | 25 |
| CNY 1m · minimum commission | 30,663.43 | 0 | 4,753 | 98 | 25 |
| Scenario | Release horizon (elapsed minutes) | Release slices | Minimum commission (CNY / parent) | Negative-cash sessions |
|---|---|---|---|---|
| CNY 1m · gross | 330 | 1 | 0 | 0 |
| CNY 1m · fees | 330 | 1 | 0 | 0 |
| CNY 10m · fees | 330 | 1 | 0 | 0 |
| CNY 100m · fees | 330 | 1 | 0 | 0 |
| CNY 10m · faster release | 30 | 1 | 0 | 0 |
| CNY 10m · split release | 120 | 5 | 0 | 0 |
| CNY 10m · weekly rebalance | 330 | 1 | 0 | 0 |
| CNY 10m · rebalance buffer | 330 | 1 | 0 | 0 |
| CNY 1m · minimum commission | 330 | 1 | 5 | 0 |
Completion aggregates all buy and sell parent orders: filled quantity divided by target quantity, weighted by each order’s target notional at its own arrival reference price. Repeated orders count again; this does not measure the remaining orders at the end of the window.
Execution uses raw minute prices, 100-share lots, T+1 and a 5% cap per minute. Release horizons of 30/120/330 elapsed minutes include lunch. Dated corporate actions are applied; confirmed halts retain nontradable valuation marks.
The minimum-commission scenario assumes CNY 5 once per parent order; actual broker charging has not been verified. Gross scenarios retain execution constraints while omitting fees.
P90 arrival shortfall uses available raw or synthetic arrival references and combines price movement, unfilled opportunity cost and fees. It is an accounting diagnostic, not causal own-order impact. Actual order data are absent, so these simulations establish neither live capacity nor impact as the dominant loss.
What the existing data can support
Both dates reproduce the earliest-minute selections with zero mismatches. On 2026-04-16, the original source is missing 960 minutes across 80 sampled stocks; this is not repaired by rerunning the calculation.
Two raw snapshot dates are checked against the saved first quote of every sampled minute. Saved event references and fixed-day five-minute paths are reported separately. This is a bounded audit, not a complete warehouse certification.
Original-file selection and missing records
Each raw security/date/clock is rescanned; comparison retains invalid first books. The daily positive-trading-amount universe is a retrospective cross-check, not a historical eligibility master or a supplier completeness certificate.
| Date | Sampled minute records | Wrong / missing first records | Missing minutes | Daily-traded stocks without raw books |
|---|---|---|---|---|
| 20210104 | 26070 | 0 | 0 | 0 |
| 20260416 | 32694 | 0 | 960 | 0 |
An order number match still needs checking
A unique matching key present by the trade is stronger than an arbitrary lookup, but does not verify side, cancel meaning, priority or completeness. Equal timestamps do not establish exchange order. Early keys lack channels. Candidate IDs are tested separately; we never choose the higher rate as proof of the correct field.
| Date | Market | Candidate ID | Side | Positive-price/quantity trades | Unique key available by trade | Repeated key available by trade | Key first appears after trade | No key found | Same first timestamp |
|---|---|---|---|---|---|---|---|---|---|
| 20210104 | Shanghai | OrderID | Buy | 758422 | 0 | 0 | 0 | 758422 | 0 |
| 20210104 | Shanghai | OrderID | Sell | 758422 | 0 | 0 | 0 | 758422 | 0 |
| 20210104 | Shenzhen | OrderID | Buy | 838079 | 815437 | 19987 | 0 | 2655 | 397467 |
| 20210104 | Shenzhen | OrderID | Sell | 838079 | 812929 | 23079 | 0 | 2071 | 431274 |
| 20260416 | Shanghai | OrderID | Buy | 1618196 | 883497 | 30054 | 0 | 704645 | 91211 |
| 20260416 | Shanghai | OrderID | Sell | 1618196 | 863624 | 31292 | 0 | 723280 | 89592 |
| 20260416 | Shanghai | DBOrderID | Buy | 1618196 | 6309 | 0 | 0 | 1611887 | 0 |
| 20260416 | Shanghai | DBOrderID | Sell | 1618196 | 6442 | 0 | 0 | 1611754 | 0 |
| 20260416 | Shenzhen | OrderID | Buy | 1855837 | 1821412 | 34425 | 0 | 0 | 914699 |
| 20260416 | Shenzhen | OrderID | Sell | 1855837 | 1819963 | 35874 | 0 | 0 | 935442 |
| 20260416 | Shenzhen | DBOrderID | Buy | 1855837 | 0 | 0 | 0 | 1855837 | 0 |
| 20260416 | Shenzhen | DBOrderID | Sell | 1855837 | 0 | 0 | 0 | 1855837 | 0 |
Larger same-day execution sensitivity
The common observed stocks use three share quantities in a fixed opening five-minute window. Each day stays separate. Paths with invalid displayed books are excluded and counted. Arrival quotes later than one minute are excluded and terminal costs need a quote no older than one minute. Share quantities are not equal cash amounts. Snapshot refresh, no own impact, no fees or passive queues remain assumptions; negative shortfall includes market moves.
| Date | Common candidate stocks | Included paths | Invalid-book exclusions | Fresh terminal benchmarks |
|---|---|---|---|---|
| 20210104 | 106 | 105 | 1 | 105 |
| 20260416 | 106 | 106 | 0 | 43 |
| Date | Shares | Side | Mode | Paths | Fully completed | Cost observations | Median shortfall (bp) |
|---|---|---|---|---|---|---|---|
| 20210104 | 1000 | Buy | Marketable limit crossings | 105 | 65 | 105 | -14.31 |
| 20210104 | 1000 | Buy | Immediate displayed-depth sweep | 105 | 105 | 105 | 12.52 |
| 20210104 | 1000 | Buy | Fixed-clock equal slices | 105 | 104 | 105 | 0.00 |
| 20210104 | 1000 | Sell | Marketable limit crossings | 105 | 45 | 105 | 2.29 |
| 20210104 | 1000 | Sell | Immediate displayed-depth sweep | 105 | 105 | 105 | 11.78 |
| 20210104 | 1000 | Sell | Fixed-clock equal slices | 105 | 104 | 105 | 19.82 |
| 20210104 | 10000 | Buy | Marketable limit crossings | 105 | 59 | 105 | -14.16 |
| 20210104 | 10000 | Buy | Immediate displayed-depth sweep | 105 | 95 | 105 | 23.53 |
| 20210104 | 10000 | Buy | Fixed-clock equal slices | 105 | 104 | 105 | 2.01 |
| 20210104 | 10000 | Sell | Marketable limit crossings | 105 | 41 | 105 | 19.44 |
| 20210104 | 10000 | Sell | Immediate displayed-depth sweep | 105 | 98 | 105 | 22.82 |
| 20210104 | 10000 | Sell | Fixed-clock equal slices | 105 | 104 | 105 | 23.16 |
| 20210104 | 100000 | Buy | Marketable limit crossings | 105 | 39 | 105 | -19.08 |
| 20210104 | 100000 | Buy | Immediate displayed-depth sweep | 105 | 45 | 105 | 35.59 |
| 20210104 | 100000 | Buy | Fixed-clock equal slices | 105 | 86 | 105 | 16.23 |
| 20210104 | 100000 | Sell | Marketable limit crossings | 105 | 22 | 105 | 29.42 |
| 20210104 | 100000 | Sell | Immediate displayed-depth sweep | 105 | 41 | 105 | 39.38 |
| 20210104 | 100000 | Sell | Fixed-clock equal slices | 105 | 88 | 105 | 38.49 |
| 20260416 | 1000 | Buy | Marketable limit crossings | 106 | 53 | 43 | -20.58 |
| 20260416 | 1000 | Buy | Immediate displayed-depth sweep | 106 | 106 | 43 | 9.99 |
| 20260416 | 1000 | Buy | Fixed-clock equal slices | 106 | 40 | 43 | -1.68 |
| 20260416 | 1000 | Sell | Marketable limit crossings | 106 | 44 | 43 | -6.87 |
| 20260416 | 1000 | Sell | Immediate displayed-depth sweep | 106 | 106 | 43 | 9.66 |
| 20260416 | 1000 | Sell | Fixed-clock equal slices | 106 | 40 | 43 | 9.95 |
| 20260416 | 10000 | Buy | Marketable limit crossings | 106 | 41 | 43 | -13.04 |
| 20260416 | 10000 | Buy | Immediate displayed-depth sweep | 106 | 98 | 43 | 18.59 |
| 20260416 | 10000 | Buy | Fixed-clock equal slices | 106 | 40 | 43 | 4.28 |
| 20260416 | 10000 | Sell | Marketable limit crossings | 106 | 36 | 43 | -6.84 |
| 20260416 | 10000 | Sell | Immediate displayed-depth sweep | 106 | 103 | 43 | 16.68 |
| 20260416 | 10000 | Sell | Fixed-clock equal slices | 106 | 40 | 43 | 9.95 |
| 20260416 | 100000 | Buy | Marketable limit crossings | 106 | 27 | 43 | -10.59 |
| 20260416 | 100000 | Buy | Immediate displayed-depth sweep | 106 | 46 | 43 | 17.47 |
| 20260416 | 100000 | Buy | Fixed-clock equal slices | 106 | 33 | 43 | 9.15 |
| 20260416 | 100000 | Sell | Marketable limit crossings | 106 | 18 | 43 | 0.00 |
| 20260416 | 100000 | Sell | Immediate displayed-depth sweep | 106 | 47 | 43 | 33.11 |
| 20260416 | 100000 | Sell | Fixed-clock equal slices | 106 | 33 | 43 | 23.59 |
How to interpret a 0.4% flat trading cost
0.4% equals 40 bp. If it is the total all-in cost, do not add the same fees or slippage again. It is higher than the 100,000-yuan static median in this selected sample, but cannot guarantee coverage of large orders, waiting or missing fills. A 0.4% round-trip cost corresponds to 20 bp per side only under a symmetric split.
| Flat all-in assumption | Linear annual expense |
|---|---|
| 40 bp on each buy and sell | 120% |
| 40 bp round trip, split equally | 60% |
At 250 sessions with buying and selling each 60% of NAV daily, linear expenses are 120% or 60%. This sums expenditure at constant capital; it is not a realized NAV loss or a compounded return. These flat assumptions are stress scenarios, not calibrated cost estimates.
These checks cannot establish real slippage. Vendor event definitions and cross-stream exchange order are still needed for full book reconstruction; actual order and fee records are needed for calibration. Missing securities require historical status and supplier coverage records.
From static books to execution calibration
Event replay: quality gate remains closed
Early Shenzhen reference lookup is audited, but event types, cancellation meanings and cross-stream exchange order remain unverified. A full book has not been reconstructed or reconciled to snapshots.
Snapshot-path counterfactual: 12 selected securities
Only 2021-01-04 quotes are used; the missing-date-filter error in v6 is corrected and superseded. The first 12 saved Shenzhen securities in lexical order use 10,000-share orders and a five-minute horizon. Displayed depth refreshes independently of our hypothetical orders. Fees, round lots and own impact are absent; these fill counts do not rank live execution algorithms.
| Mode | Fully filled buy paths | Fully filled sell paths |
|---|---|---|
| Immediate displayed-depth sweep | 11 / 12 | 12 / 12 |
| Fixed-clock TWAP | 12 / 12 | 12 / 12 |
| Limit wait: crossings only | 7 / 12 | 6 / 12 |
Participation-constrained mode is unavailable until cumulative-volume units, resets, auctions and trailing intervals are verified. Passive queue fills remain unidentified; only crossing fills are simulated.
Real-order entry is ready; actual calibration is pending
Canonical orders, fills and past available quotes feed signed decision/arrival costs, unfilled opportunity cost and actual fees. Training parents must finish before the holdout starts. The 80-parent synthetic check verifies the pipeline, not real slippage. No actual order files have been supplied to this study.
Market-adjusted terminal responses and chronological prediction errors are implemented in the research entry. They describe association; identifying causal own impact needs additional controls and reviewed execution-comparison evidence.
Turnover definitions and cost sensitivity
Illustrative assumptions: 250 sessions, constant NAV, no leverage, 1 bp inclusive commission on each side and 5 bp sell-side tax. Confirm the fee date and broker invoice before use; do not add included levies again. 1 bp = 0.01%.
For balanced fully invested rebalances without flows: one-way turnover = half of the sum of absolute weight changes. A 60% sum means about 30% buying and 30% selling.
Annual linear cost expenditure = days × [buy turnover × (buy fees + buy slippage) + sell turnover × (sell fees + sell slippage)]. Rates use decimals.
| Slippage on each side (bp) | 60% buying + 60% selling | 30% buying + 30% selling |
|---|---|---|
| 0 | 10.50% | 5.25% |
| 1 | 13.50% | 6.75% |
| 3 | 19.50% | 9.75% |
| 5 | 25.50% | 12.75% |
| 10 | 40.50% | 20.25% |
This table is arithmetic sensitivity, not observed annual return or NAV loss; trading frequency and funding are not simulated. Slippage must use a named benchmark. Midpoint-based book walking already includes half-spread and depth cost: do not add spread or the same impact twice. Unfilled orders and opportunity costs require a separate ledger.
What Level-2 can establish
Ten-level snapshots measure quoted spread, depth and static buy/sell benchmarks. Own-order impact remains uncalibrated. Report P50/P90/P95 and depth coverage. Insufficient depth means incomplete coverage, never extrapolated fills.
Orders and trades: validate event order, units, cancellation links and zero-price semantics before estimating signed flow or price response. Historical replay cannot identify the causal impact of a fictional order.
Actual order and fill reports: calibrate implementation shortfall against the decision price, including partial fills, cancellations, fees and unfilled quantity. No such calibration is published here yet.
Next experiments and publication gates
The original simulator’s 5 bp charge has been removed before applying the new fee assumptions. Next, reconcile dated fee rates and minimum commissions against actual broker statements.
Ten dates and trading-amount, market-value and volatility groups are published. Next, verify earliest source records per minute, historically eligible securities that are entirely absent, and predeclared normal and stressed sessions.
The earlier eighteen fee scenarios remain available. A separate 40-security diagnostic now reports eighteen funded minute scenarios across 2024 H2 and 2025, including fixed splitting and unfilled orders. Real orders are needed for execution calibration before estimating live capacity.
Publish only after semantic checks, sample manifests, benchmark definitions, exclusions and time-based out-of-sample validation are reviewable. Raw vendor data and order records stay outside this repository.
Methods, related evidence and reading
The linked papers are a reading queue, not a calibration dataset. Full texts and historical fee assumptions still need review; no quoted cost parameter is adopted here.
Research notes and evidence history
· Frozen-name exit budgets and revision baseline
Per-stock budget coverage follows fixed 2024–2025 month-end groups with a conservative sell sensitivity. A continuous-month minute probe and exact feature revision gate retain unresolved evidence.
Read methods and evidence ↗· Stress months, frozen cohorts and recorded clock windows
Within-year low-turnover months are compared with other months; month-end groups are followed for 20 observations. A 15-date minute sample adds window-share sensitivity with stock-day qualification gates.
Read methods and evidence ↗· SH/SZ scope and lifecycle sensitivity
SH/SZ-only results replace the mixed BSE daily aggregates. Lifecycle cross-checks leave tested observations unchanged, while daily minimum stock counts constrain turnover-budget ranges.
Read methods and evidence ↗· Daily, minute and Level 2 coverage audit
A-share 1-minute turnover now reconciles to daily turnover over the published history. Aggregate totals are close, with residual stock-day discrepancies and selected-date L2 limits disclosed.
Read methods and evidence ↗· Empty buckets and relative size
Market coverage remains visible when a size bucket is empty. Daily within-market quintiles add a separate relative comparison.
Read methods and evidence ↗· Four-market recomputation and source audit
Common-date and historical summaries now use explicit lagged means/medians and prior FX. Sparse US source dates are isolated; Japanese shares remain exploratory.
Read methods and evidence ↗· Distribution tails and minute/daily follow-up
Turnover distributions now expose P10/P25/P50/P75/P90 and observed zero-ADV20 shares. Targeted reconciliation isolates Beijing-exchange discrepancies but cannot establish their cause or a full-universe zero-trade rate.
Read methods and evidence ↗· Count and metric audit
Archived inherited release: conflicting A-share counts remain unverified. Recomputed results are maintained separately.
Read methods and evidence ↗· Three-day static pilot
Measured spread and ten-level depth; costs are conditional on full coverage.
Read methods and evidence ↗· Ten-date expansion
311,395 sampled snapshots; 306,483 valid and 4,912 excluded. Selected dates do not establish population estimates.
Read methods and evidence ↗· Data fitness and corrected replay
Same-date paths were corrected. Vendor semantics and cross-stream ordering remain unverified.
Read methods and evidence ↗Next evidence to collect
Extend source coverage, validate Japanese shares and point-in-time membership, obtain a complete listed/suspended universe and actual parent-order records, and compare source-specific turnover definitions before drawing cross-market conclusions.